Current load and volume
- Ingress and egress PPS
- Ingress and egress Mbps
- Packet and byte counters
- Active flows
Monitoring / OpenTelemetry native
XLB exposes traffic, connection, backend load, capacity, and discovery metrics. Use ready-to-import Grafana and Datadog packages for fleet-wide monitoring, plus a local status interface for immediate health.
What XLB measures
A process-up check is not enough at millions of requests per second. XLB shows whether traffic is balanced, backends are responding, connection health is changing, and the load-balancer tier is approaching a limit.
Ready to use
The same metric contract powers the local status interface, Grafana dashboards, and Datadog dashboards. Your team gets a useful default without giving up its existing monitoring stack.
Immediate per-instance traffic, backend, capacity, and health information with no external monitoring dependency.
Premade Collector and Prometheus configuration, cluster-wide dashboards, backend health views, and alert rules.
Premade dashboard, OpenTelemetry Collector configuration, and monitors for XLB traffic, capacity, and backend health.
Built-in status interface
Get one-second visibility into traffic, connections, backends, and capacity on every XLB instance without setting up an external monitoring platform.
Use the premade Grafana and Datadog packages for cluster-wide history, dashboards, and alerts.
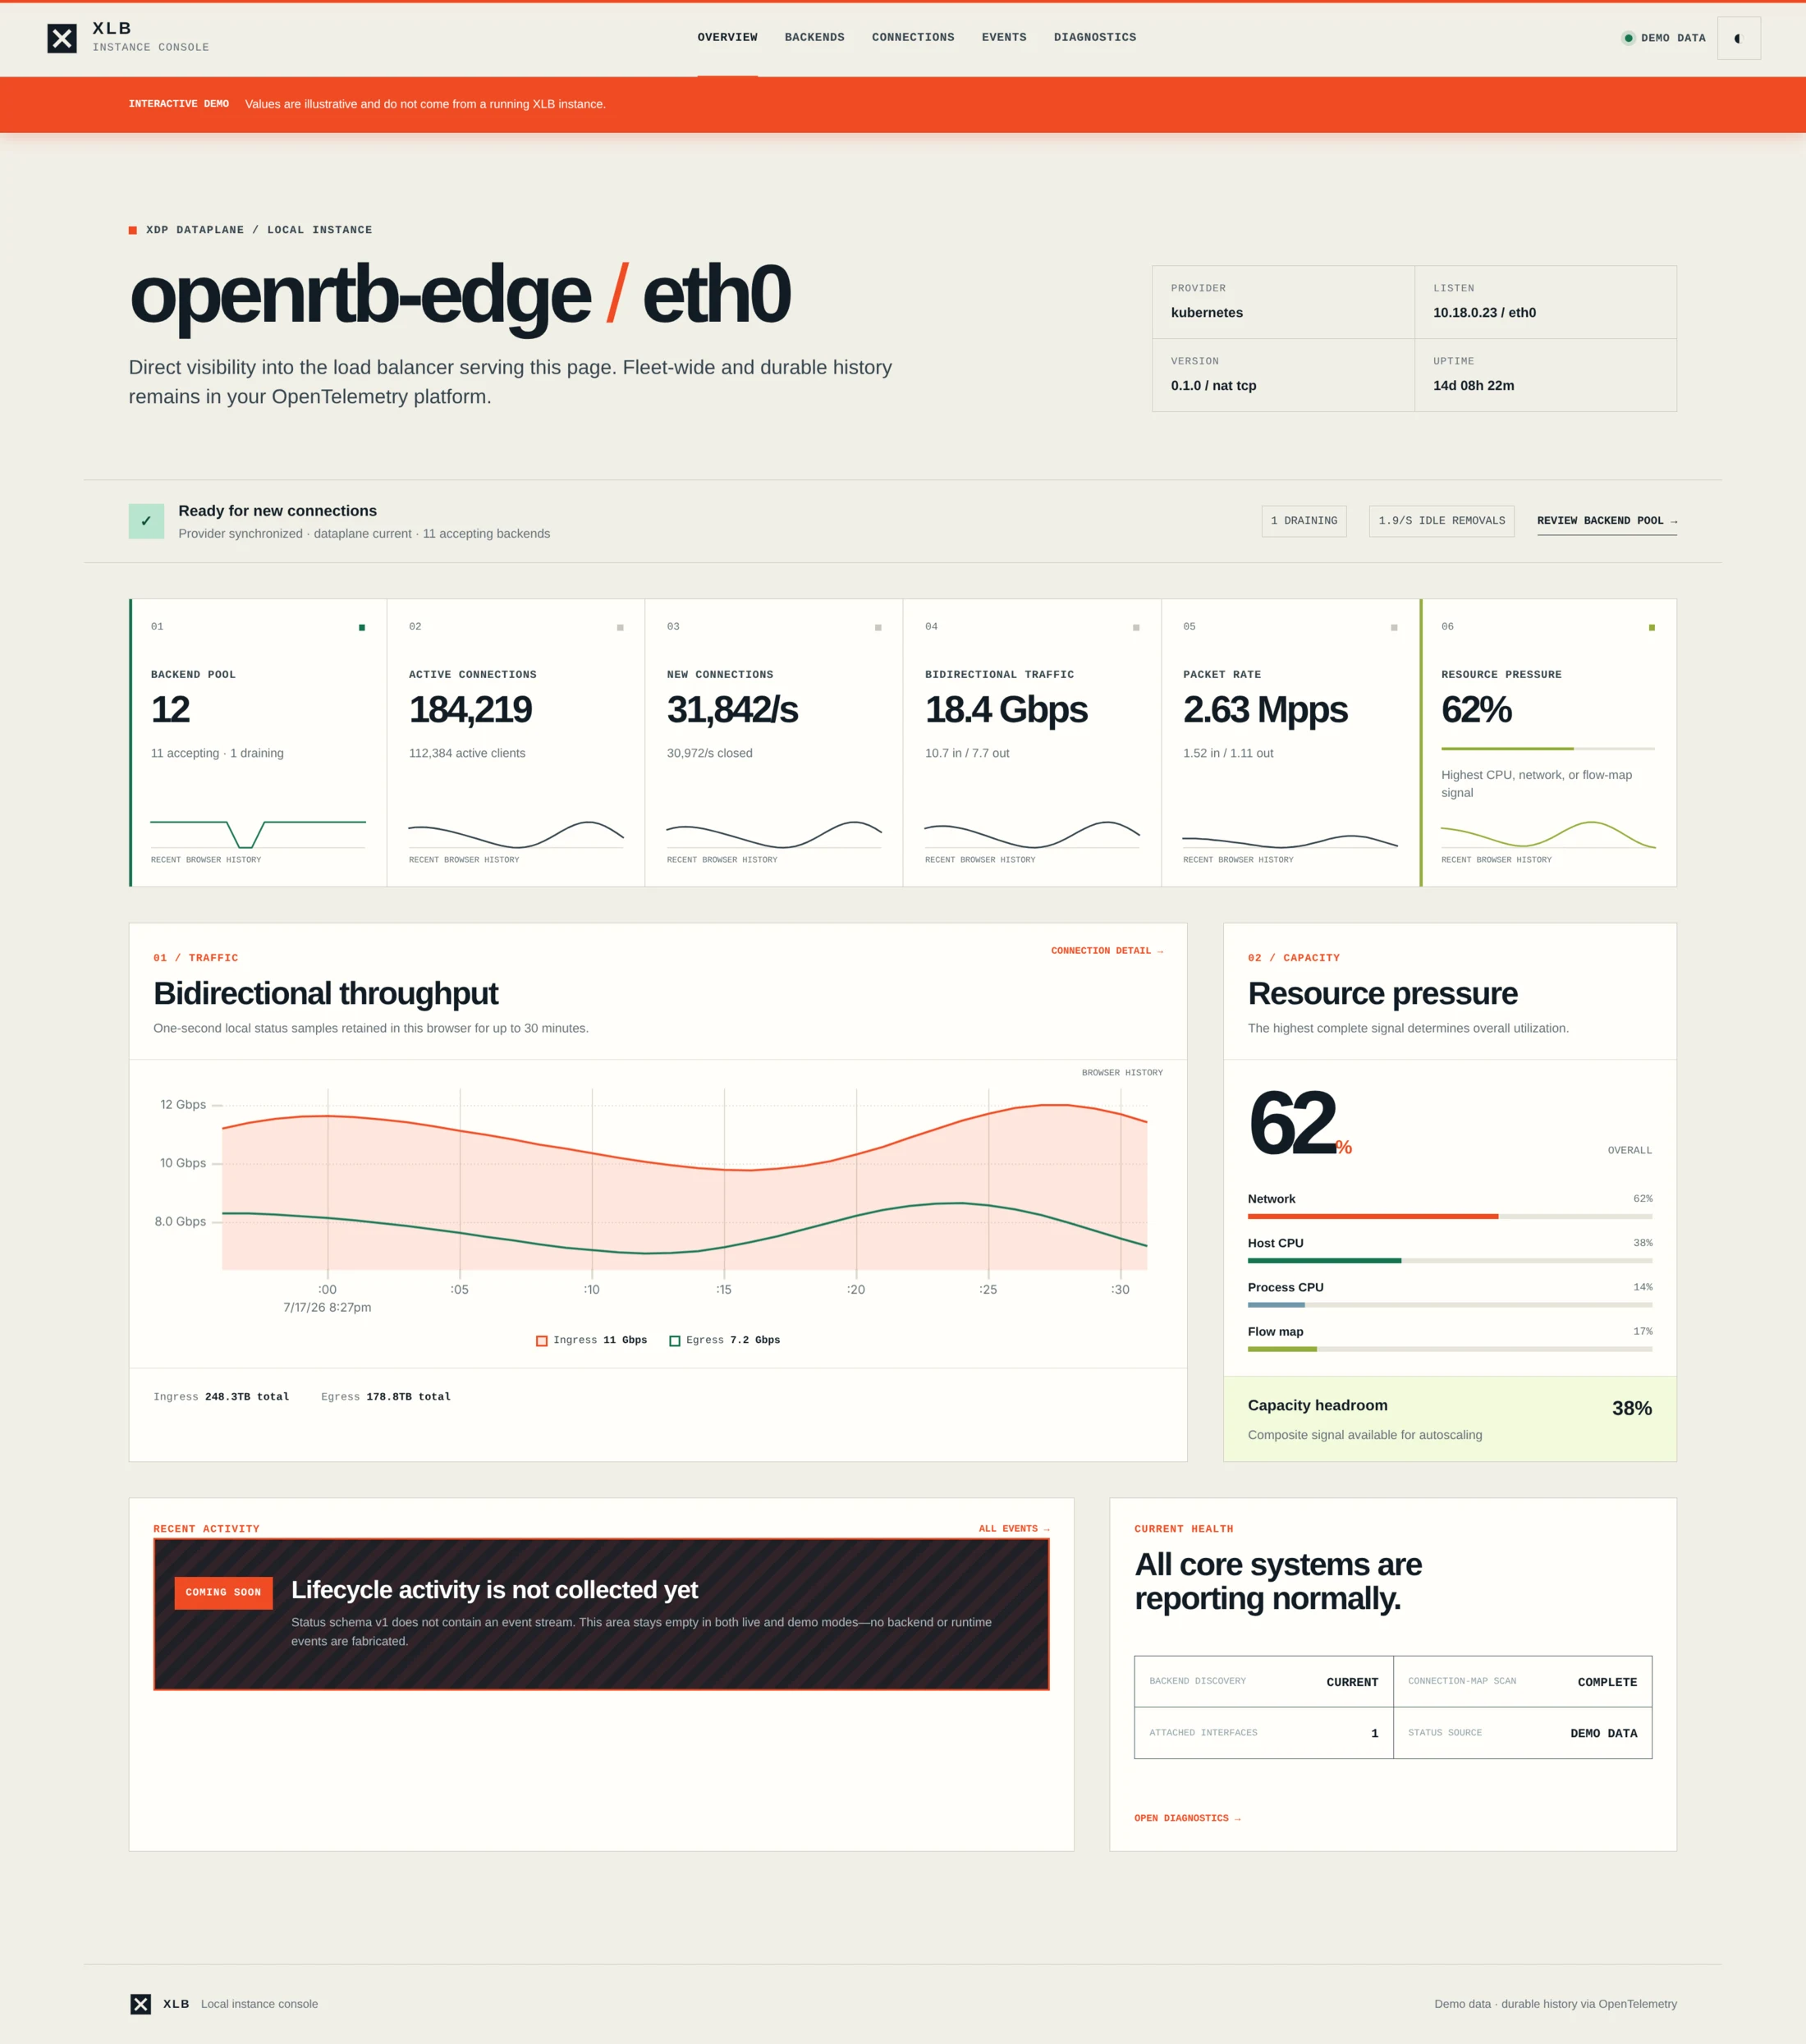
Traffic, connection load, backend readiness, and capacity headroom in one local view.
Open full screenshot ↗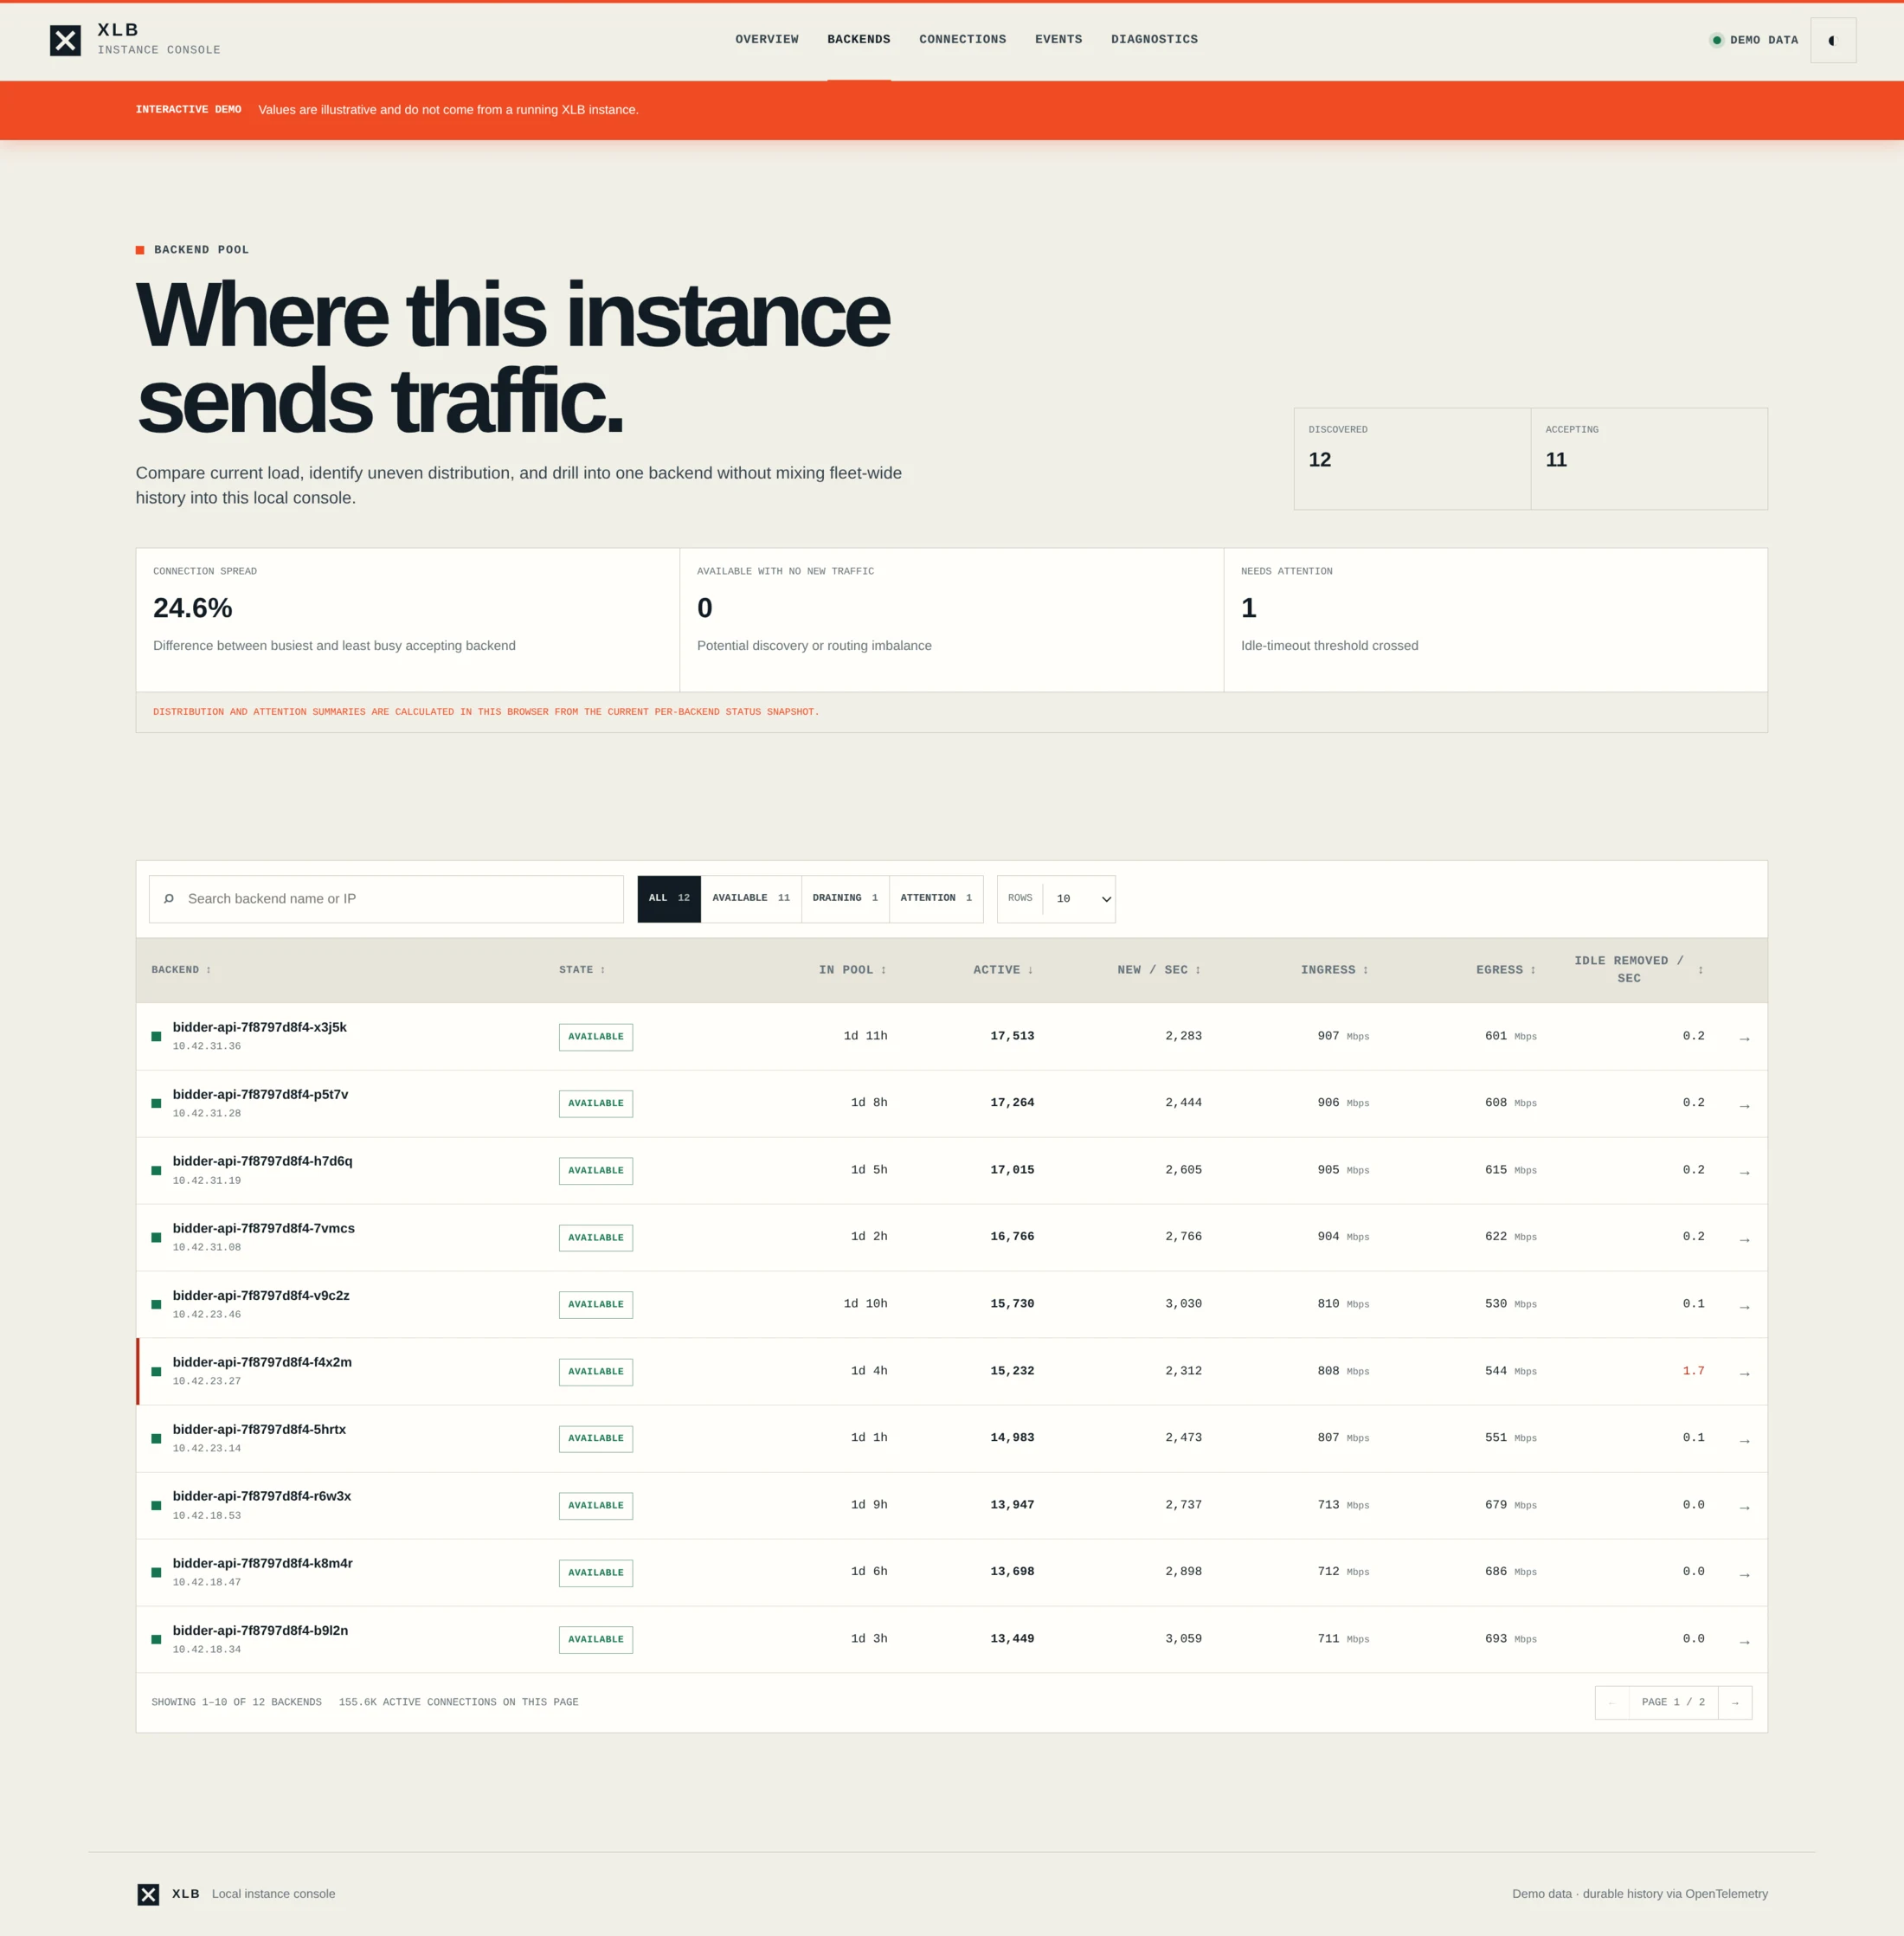
Compare load, traffic, state, and idle removals across every backend serving the instance.
Open full screenshot ↗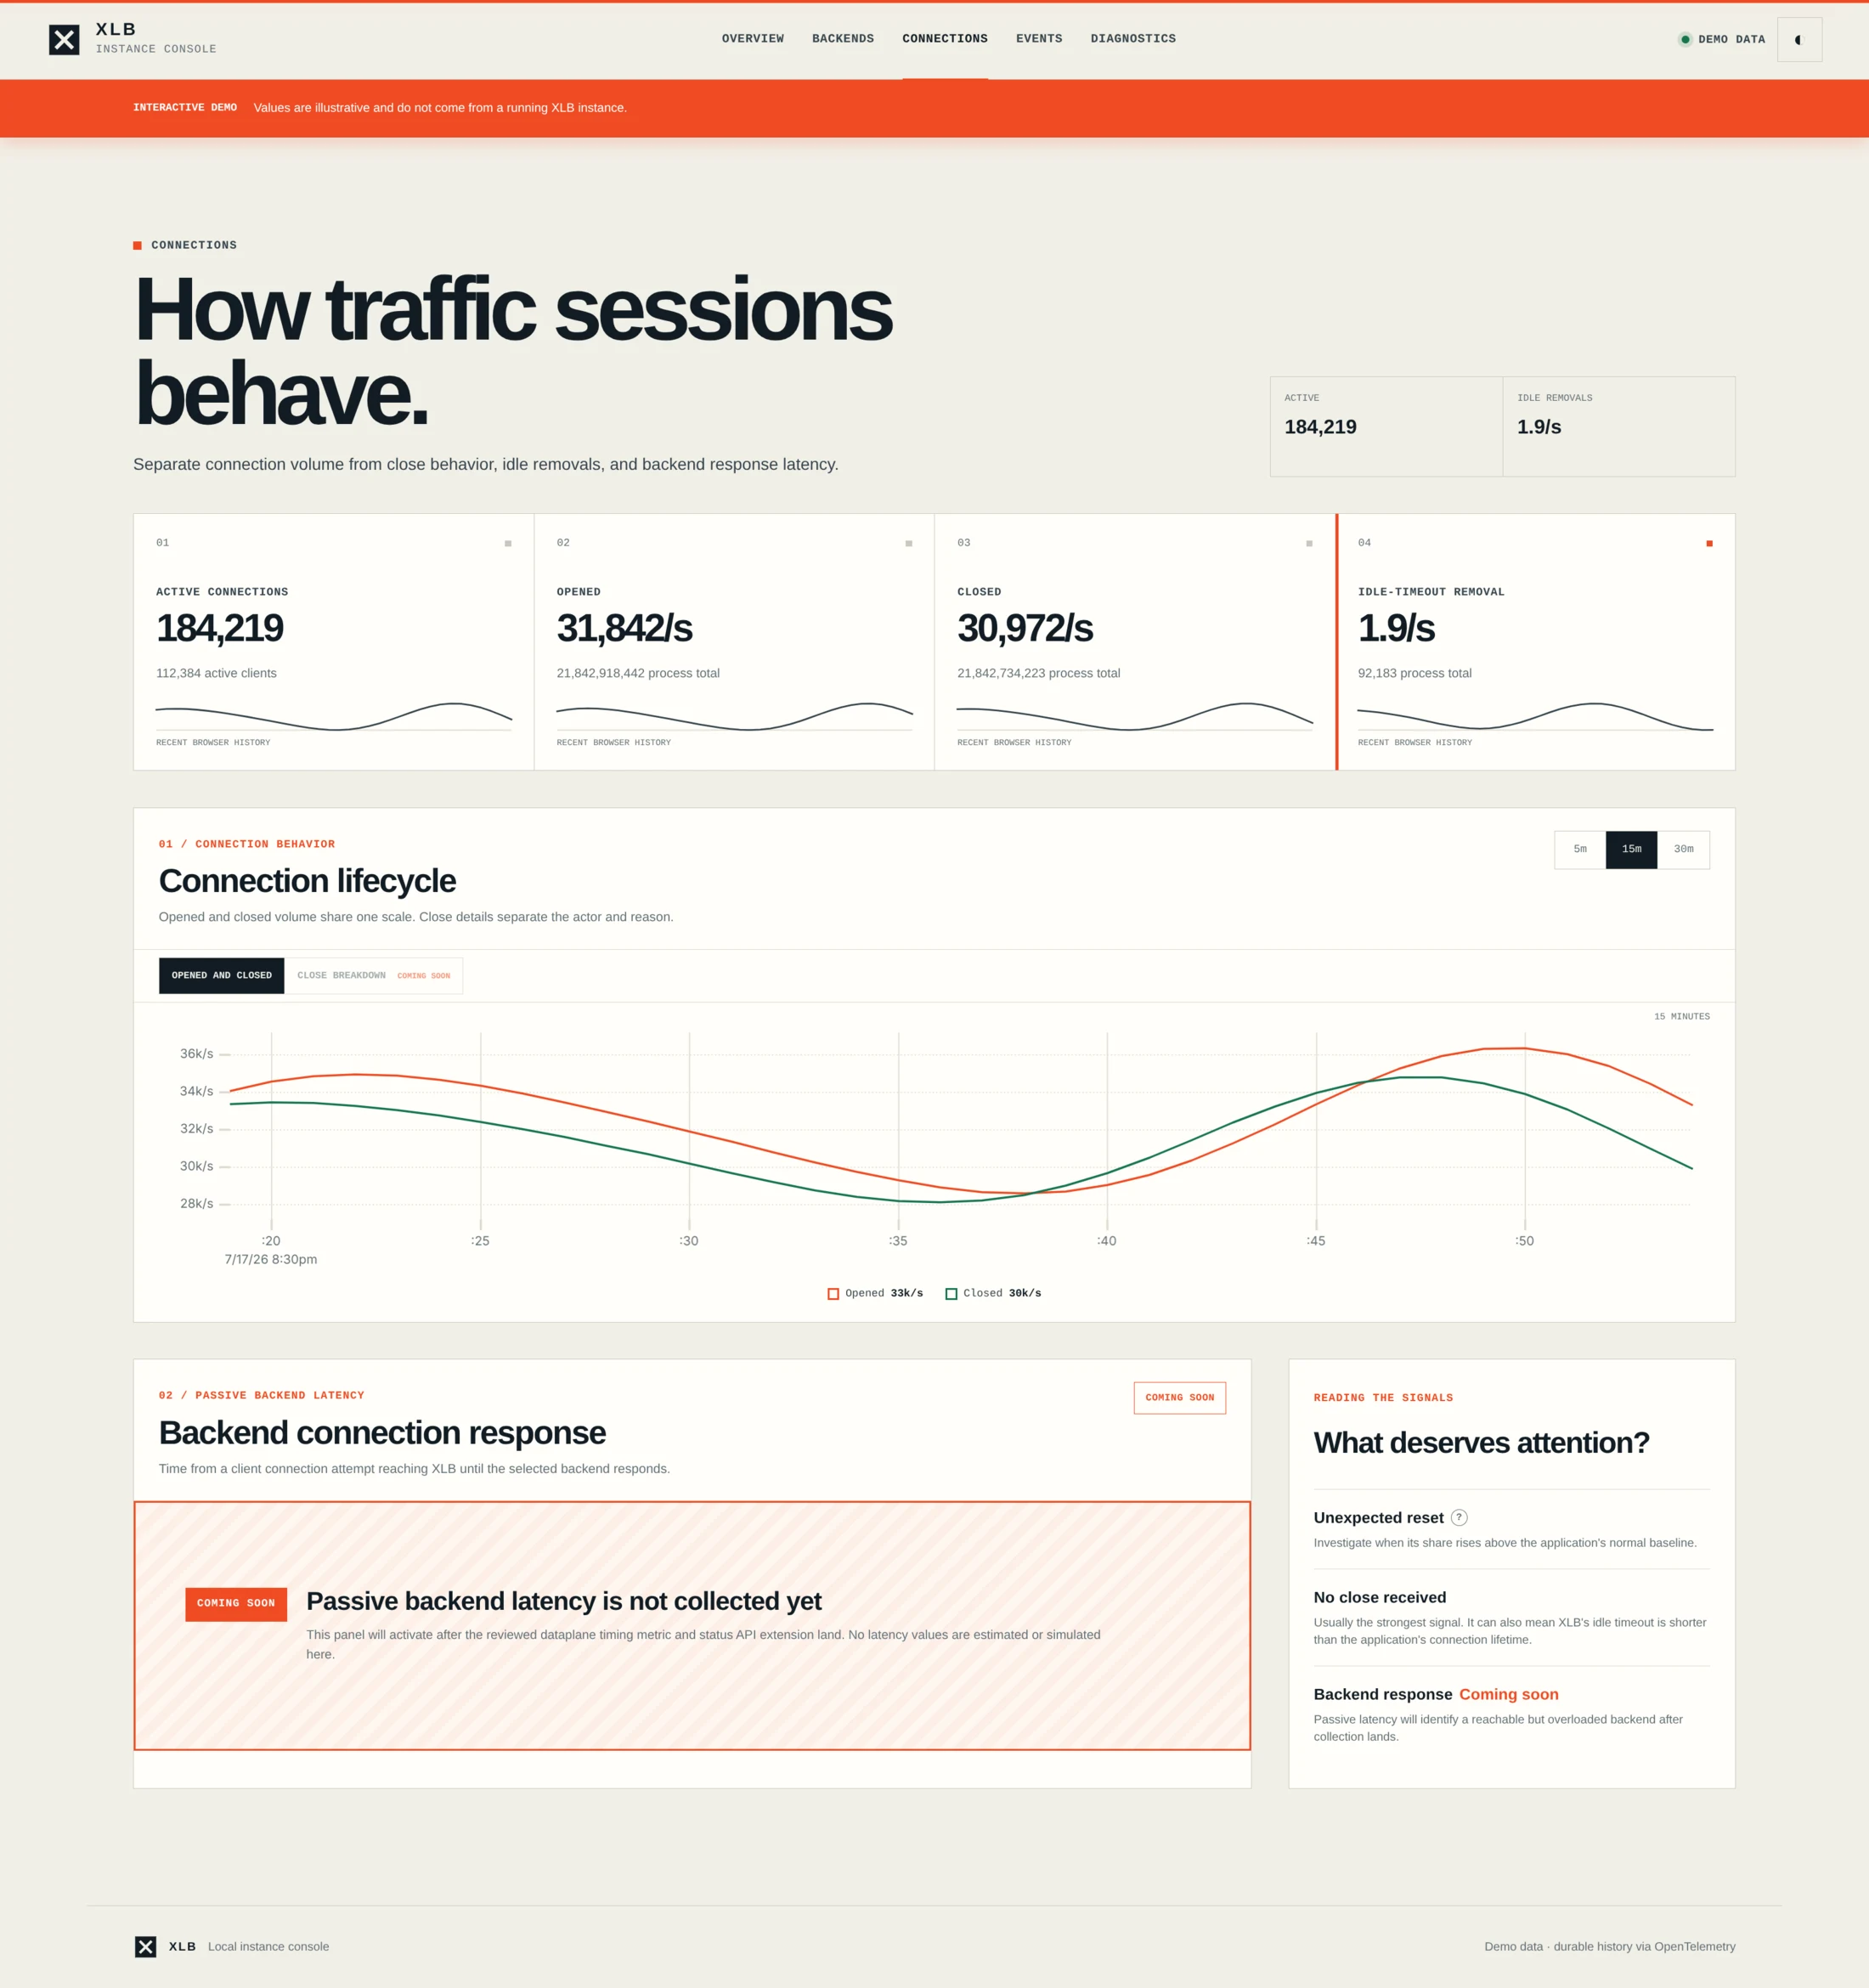
Separate active, opened, closed, and idle-timeout activity with short local history.
Open full screenshot ↗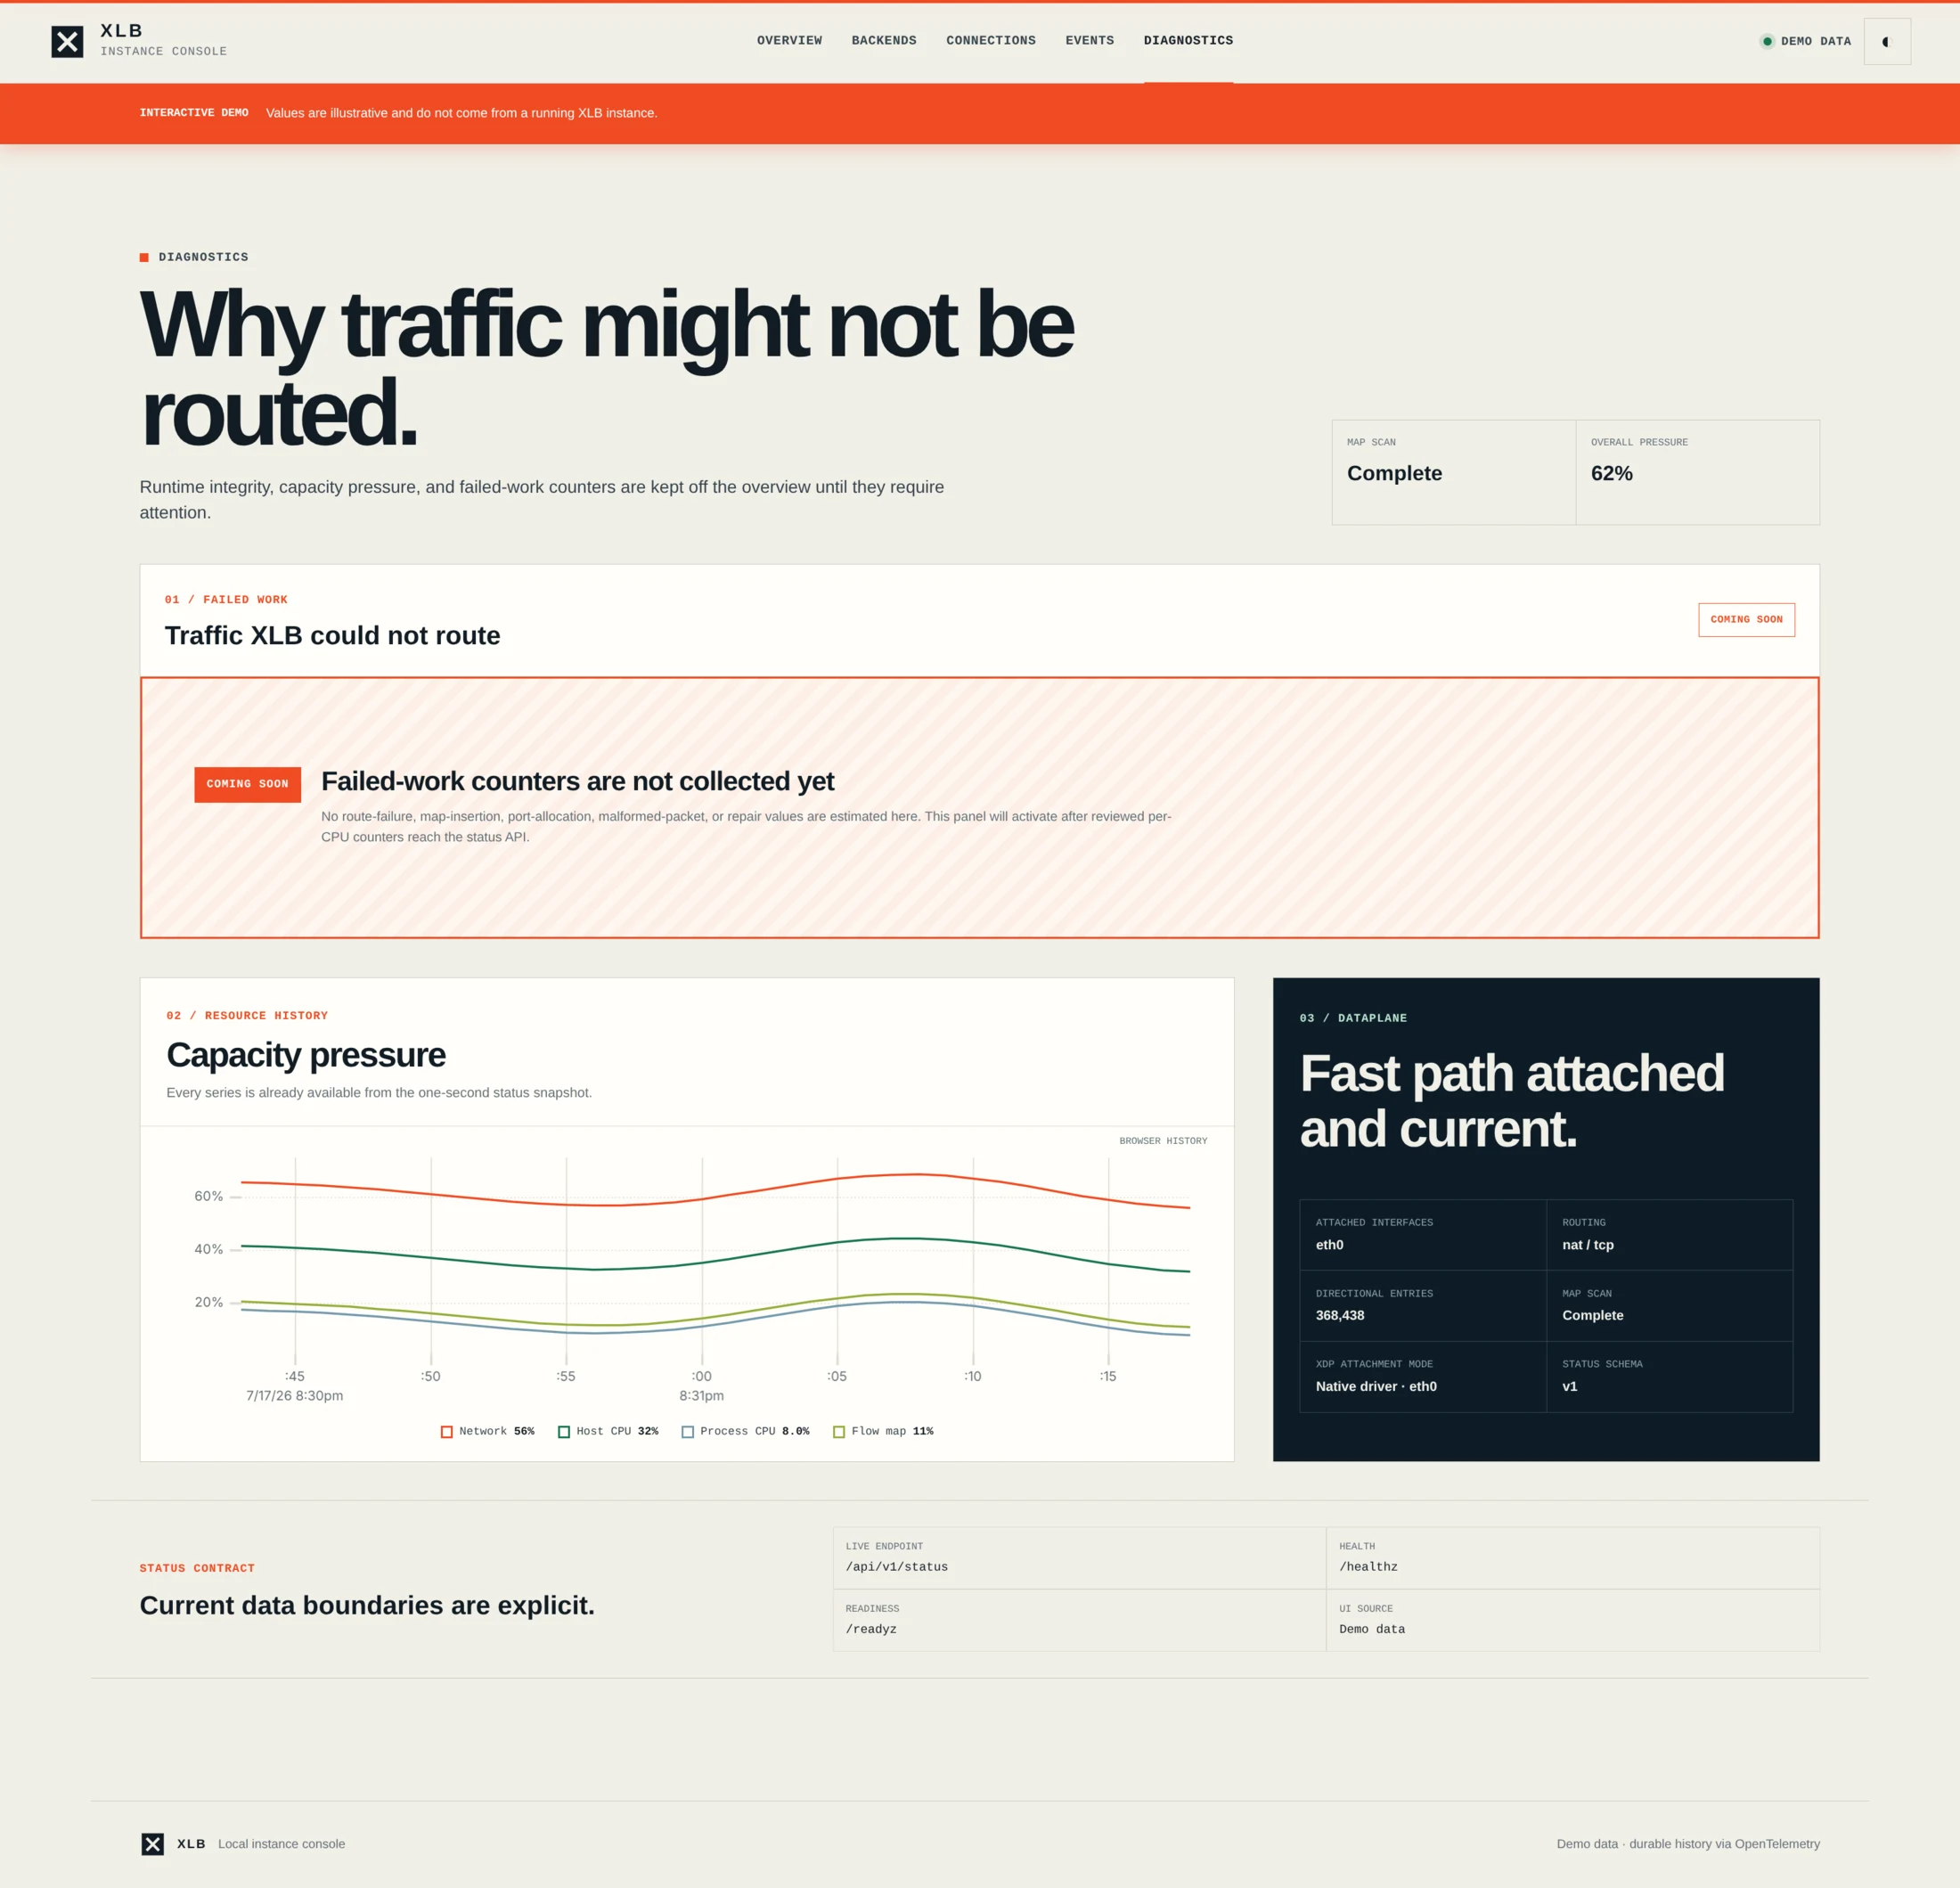
See resource pressure, dataplane attachment, failed work, and current status boundaries.
Open full screenshot ↗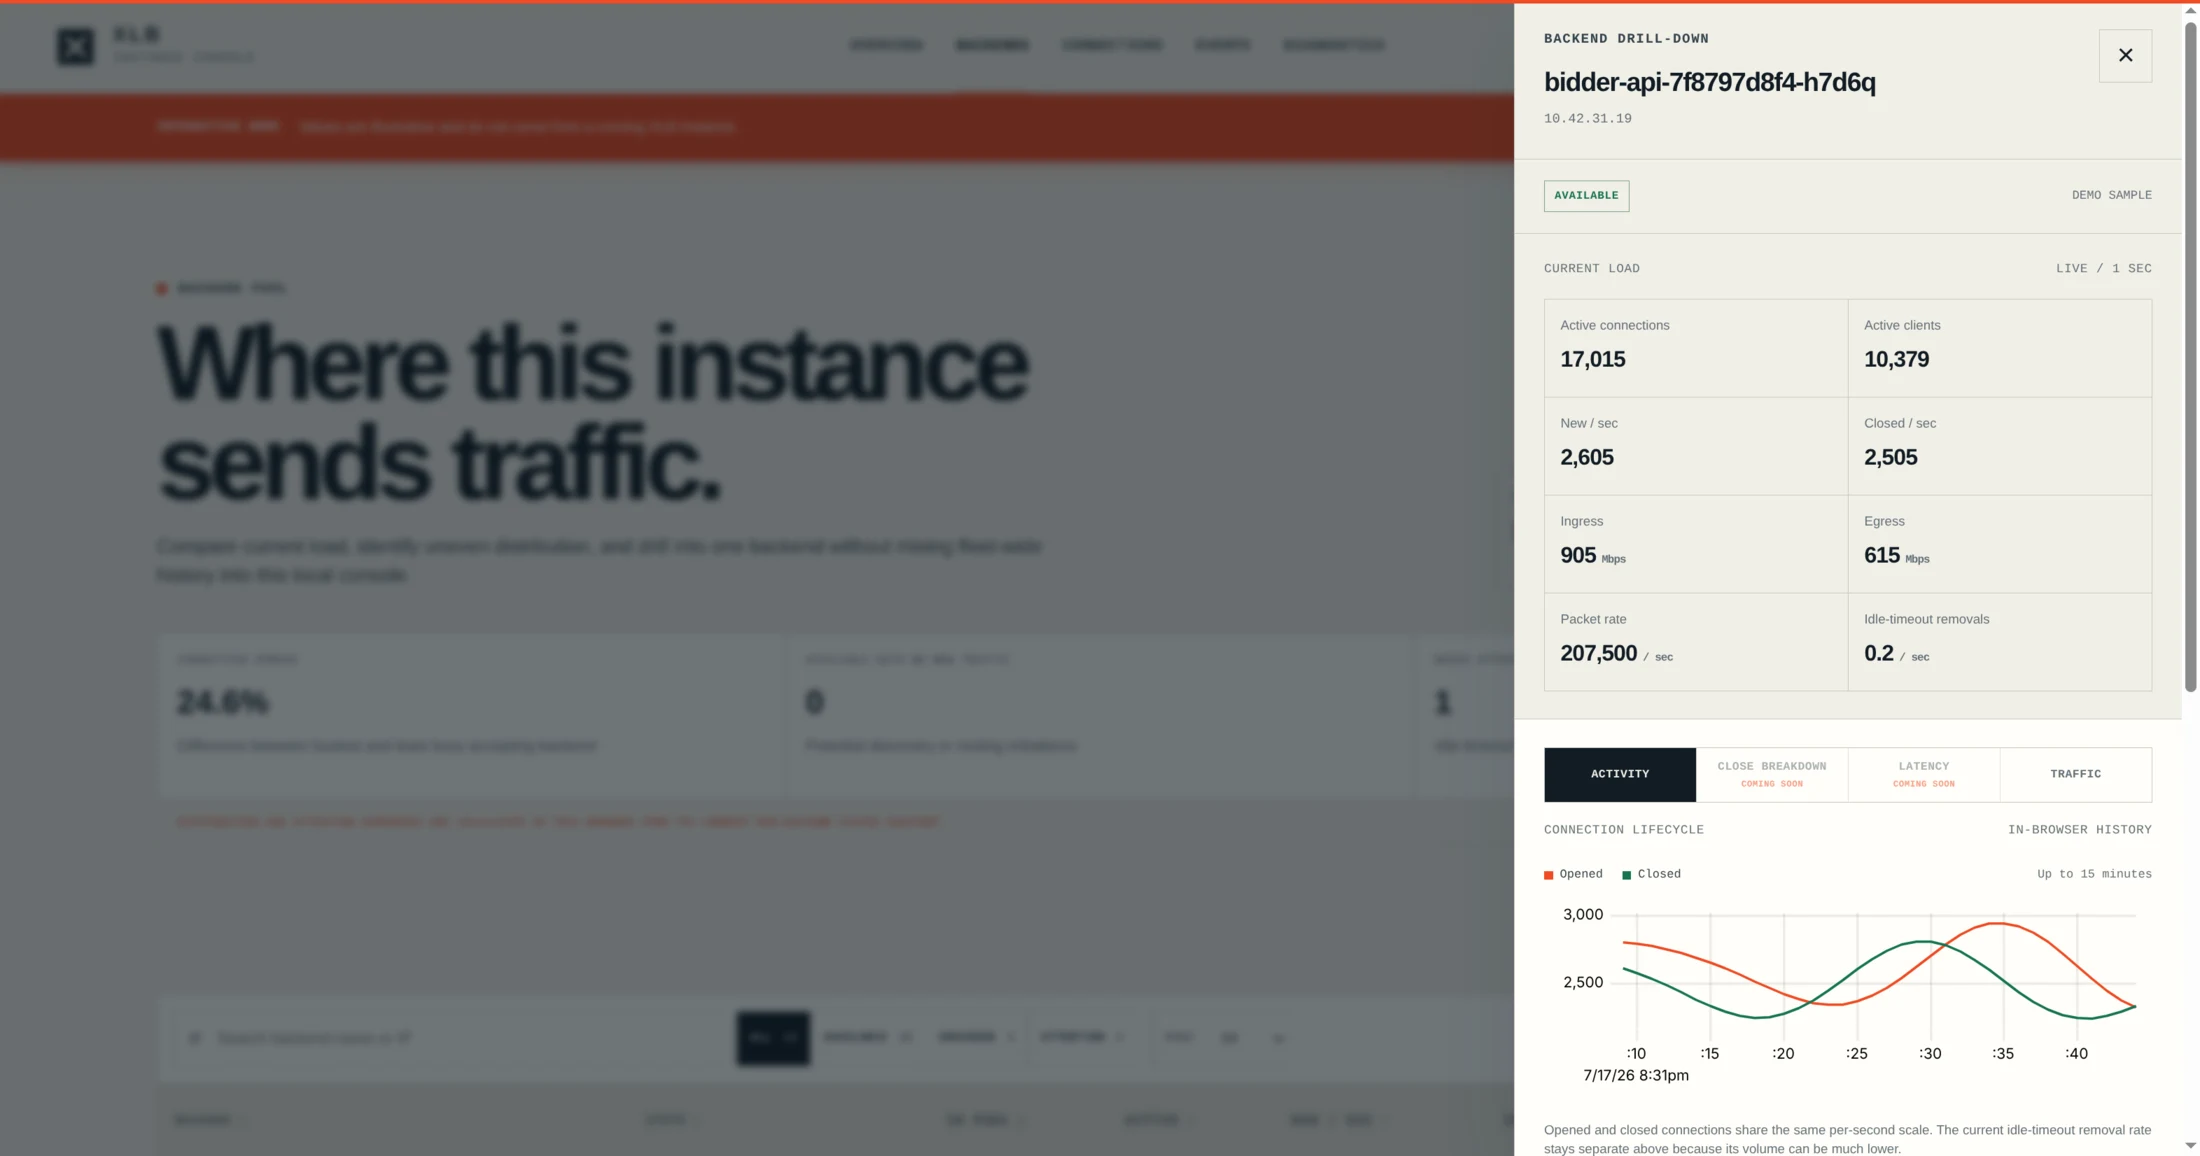
Open one backend to inspect current load and its recent connection activity.
Open full screenshot ↗Screens use demo data. Panels marked Coming Soon are not yet available in live mode.
Monitoring questions
The local status snapshot updates every second. The OTLP export interval is configurable, so teams can choose a one-second high-resolution profile or a lower-volume interval.
Yes. The premade configurations combine instances by service, cluster, namespace, node, or instance for shared dashboards, history, and alerts.
Yes. Backend identity is included on connection, response, lifetime, and failure metrics so dashboards can expose load imbalance, rising reset rates, slow handshakes, and other backend-specific changes.
Yes. XLB exports CPU and network utilization metrics that can drive Kubernetes autoscaling policies. The load-balancing tier can add or remove replicas as traffic changes while each instance continues to follow the same Service independently.
See XLB under load
We’ll validate throughput, backend behavior, capacity signals, and the monitoring path against your real traffic profile.